How to Send Docker Container Logs to Elastic Stack

In this blog , we will learn How to Send Docker Logs to the Elastic Stack. We will set up an ELK (Elasticsearch, Logstash, and Kibana) stack using Docker and configure Filebeat to collect and forward Docker container logs to Elasticsearch. The ELK Stack is a powerful combination of tools for centralized logging, and Docker Compose makes it easy to deploy and manage these services in a containerized environment. By the end of this guide, you’ll have a fully functional logging pipeline that sends Docker logs to Elasticsearch and visualizes them in Kibana.
Step #1:Install Docker and Docker Compose..!
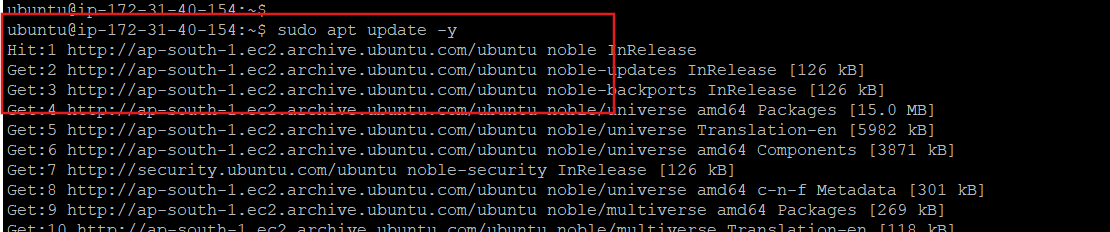
First update the package list
sudo apt update
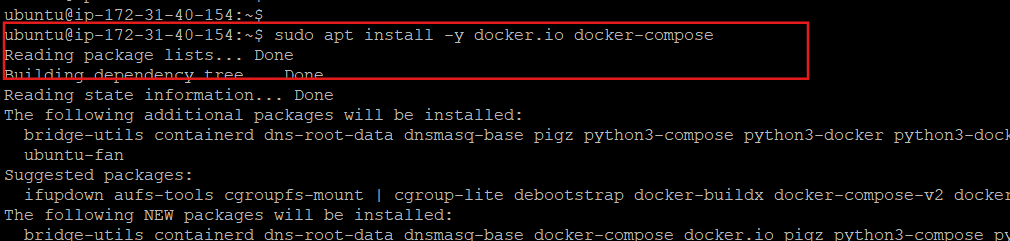
If Docker and Docker Compose are not already installed, you can install them using the following command.
sudo apt install -y docker.io docker-compose
Step #2:Set Up the Elastic Stack with Filebeat
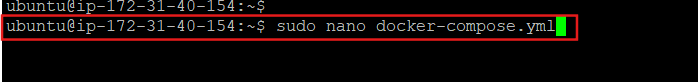
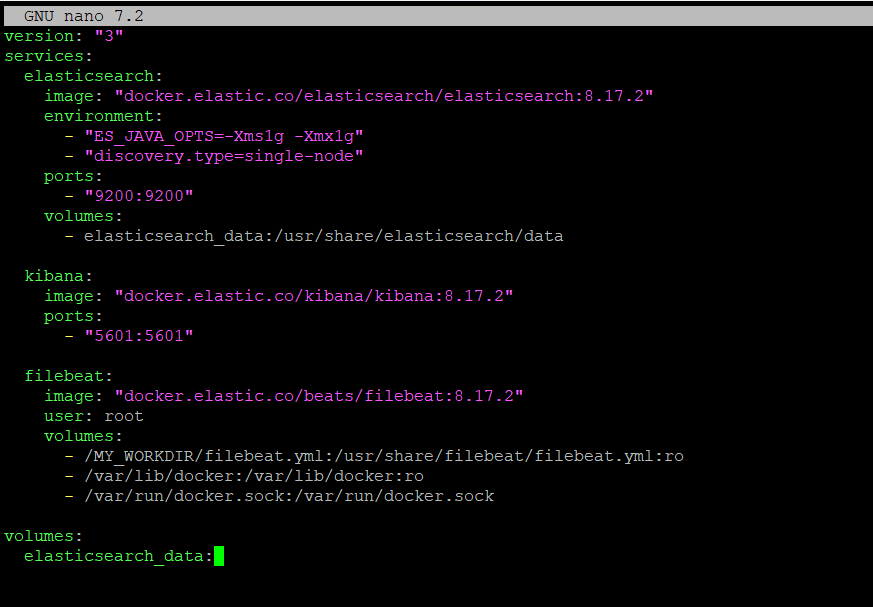
Create a docker-compose.yml file to define the Elasticsearch, Kibana, and Filebeat services
sudo nano docker-compose.yml
Add the following content.
version: "3"
services:
  elasticsearch:
    image: "docker.elastic.co/elasticsearch/elasticsearch:8.17.2"
    environment:
      - "ES_JAVA_OPTS=-Xms1g -Xmx1g"
      - "discovery.type=single-node"
    ports:
      - "9200:9200"
    volumes:
      - elasticsearch_data:/usr/share/elasticsearch/data

  kibana:
    image: "docker.elastic.co/kibana/kibana:8.17.2"
    ports:
      - "5601:5601"

  filebeat:
    image: "docker.elastic.co/beats/filebeat:8.17.2"
    user: root
    volumes:
      - /MY_WORKDIR/filebeat.yml:/usr/share/filebeat/filebeat.yml:ro
      - /var/lib/docker:/var/lib/docker:ro
      - /var/run/docker.sock:/var/run/docker.sock

volumes:
  elasticsearch_data:
Explaination Of This code
Elasticsearch: Stores and indexes logs.
ES_JAVA_OPTS: Configures Java heap size.discovery.type=single-node: Sets up Elasticsearch as a single-node cluster.
Kibana: Provides a web interface for log visualization.
Filebeat: Collects logs from Docker containers and sends them to Elasticsearch.
- Mounts the Docker logs directory (
/var/lib/docker) and the Docker socket (/var/run/docker.sock) for log collection.
- Mounts the Docker logs directory (
Step # 3 : Configure Filebeat in Docker
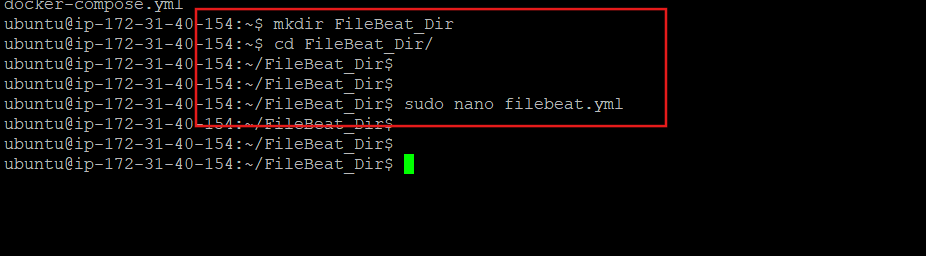
Create a directory for Filebeat configuration and inside the directory create a filebeat.yml file.
sudo mkdir /FileBeat_Dir && sudo nano/FileBeat_Dir/filebeat.yml
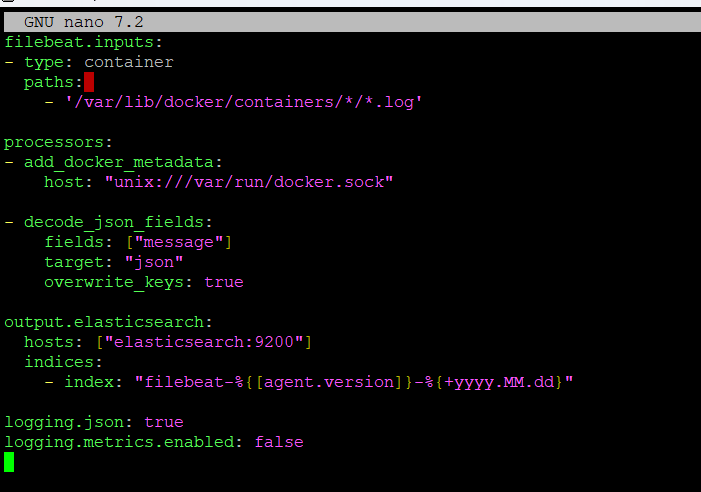
Add the following configuration.
filebeat.inputs:
- type: container
  paths:
    - '/var/lib/docker/containers/*/*.log'

processors:
- add_docker_metadata:
    host: "unix:///var/run/docker.sock"

- decode_json_fields:
    fields: ["message"]
    target: "json"
    overwrite_keys: true

output.elasticsearch:
  hosts: ["elasticsearch:9200"]
  indices:
    - index: "filebeat-%{[agent.version]}-%{+yyyy.MM.dd}"

logging.json: true
logging.metrics.enabled: false
Explanation of the code:
Inputs: Collects logs from Docker containers.
Processors:
add_docker_metadata: Adds Docker metadata to logs.decode_json_fields: Parses JSON logs for better indexing.
Output: Sends logs to Elasticsearch with authentication.
Logging: Configures Filebeat logging in JSON format.
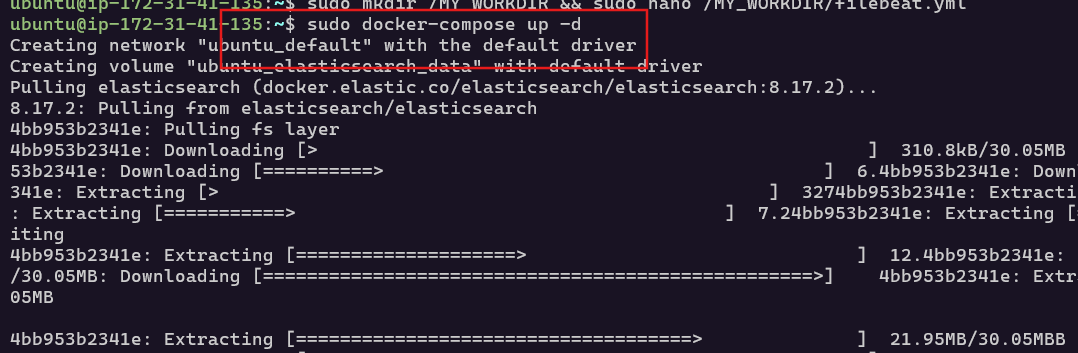
Step #4:Start the ELK Stack using Docker Composer
sudo docker-compose up -d
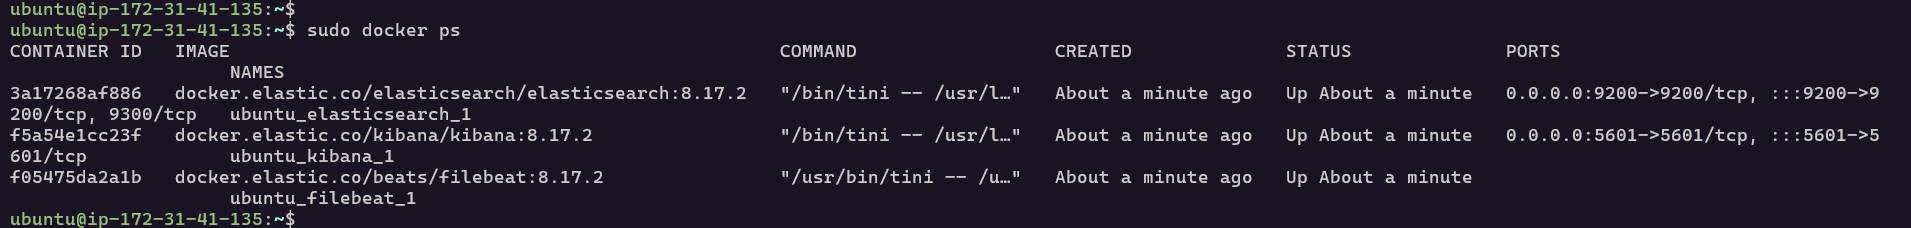
Verify that the containers are running.
sudo docker ps
Step #5:Setup Elasticsearch and Filebeat
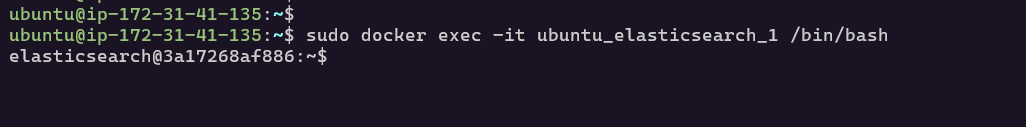
Elasticsearch 8.x enables security by default. Reset the password for the elastic user.Access the Elasticsearch container.
sudo docker exec -it ubuntu_elasticsearch_1 /bin/bash
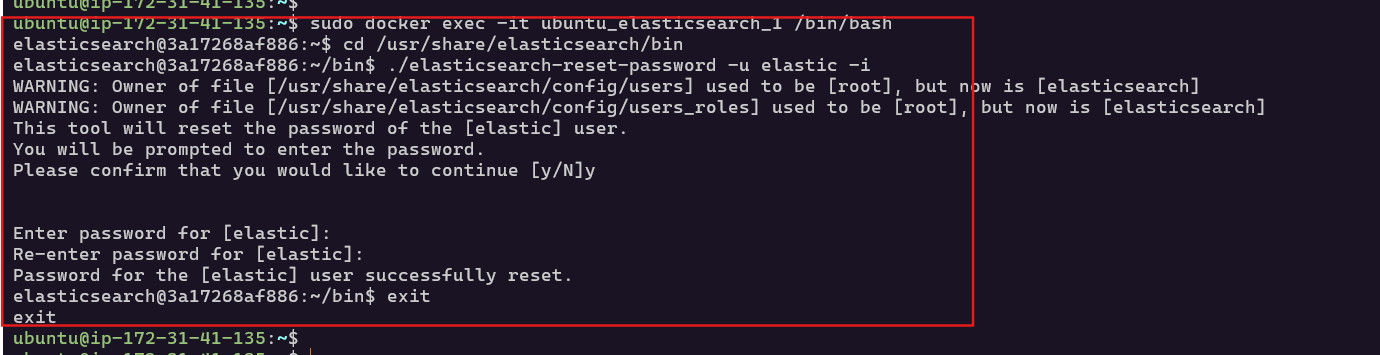
Reset the password and it will ask to set a new password. Then exit the container.
cd /usr/share/elasticsearch/bin
./elasticsearch-reset-password -u elastic -i
exit
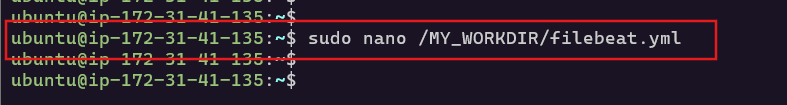
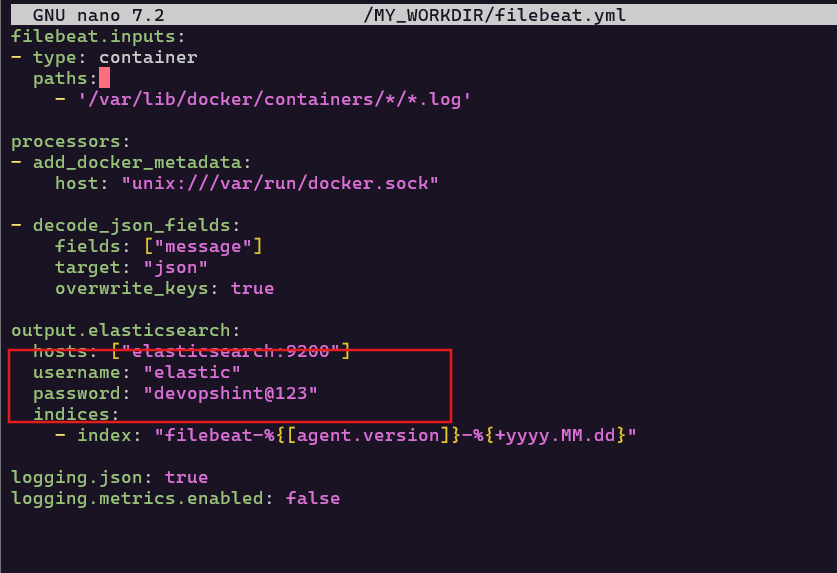
Update the Filebeat configuration to include the Elasticsearch credentials.
sudo nano /MY_WORKDIR/filebeat.yml
filebeat.inputs:
- type: container
  paths:
    - '/var/lib/docker/containers/*/*.log'

processors:
- add_docker_metadata:
    host: "unix:///var/run/docker.sock"

- decode_json_fields:
    fields: ["message"]
    target: "json"
    overwrite_keys: true

output.elasticsearch:
  hosts: ["elasticsearch:9200"]
  username: "elastic"
  password: "devopshint@123"
  indices:
    - index: "filebeat-%{[agent.version]}-%{+yyyy.MM.dd}"

logging.json: true
logging.metrics.enabled: false
Save and exit the file.
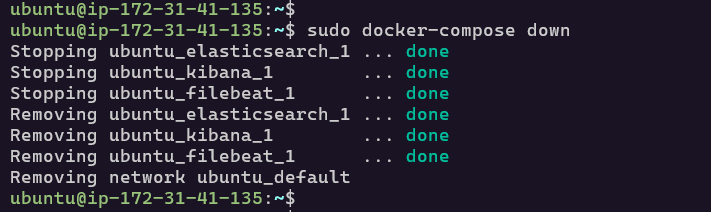
Restart the containers.
sudo docker-compose down
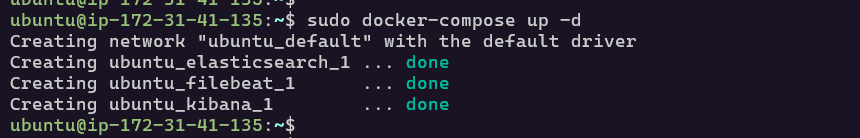
sudo docker-compose up -d
Test the connection to Elasticsearch using the elastic user credentials.
curl -u elastic:devopshint@123 http://localhost:9200
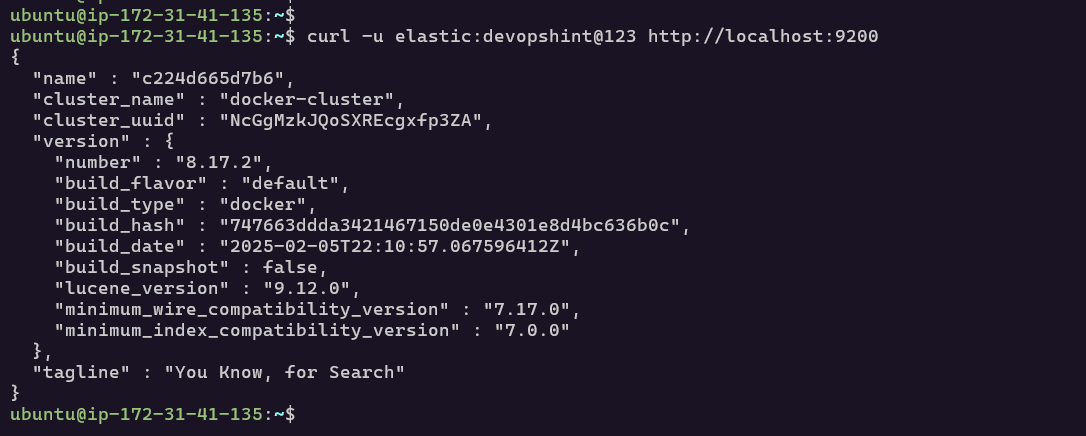
You should see a response with Elasticsearch cluster details.
Step #6:Setup Kibana
To securely connect Kibana to Elasticsearch, generate a service account token.
curl -u elastic:devopshint@123 -X POST "http://localhost:9200/_security/service/elastic/kibana/credential/token/my-token"; echo

Save the value field from the response.
Generate an encryption key.
openssl rand -hex 32
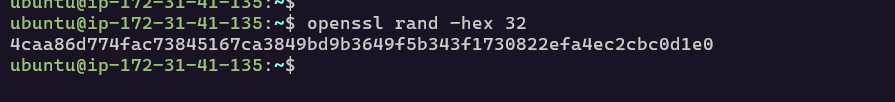
Save the generated encryption key.
Update the docker-compose.yml file to include the service account token and encryption keys.
sudo nano docker-compose.yml

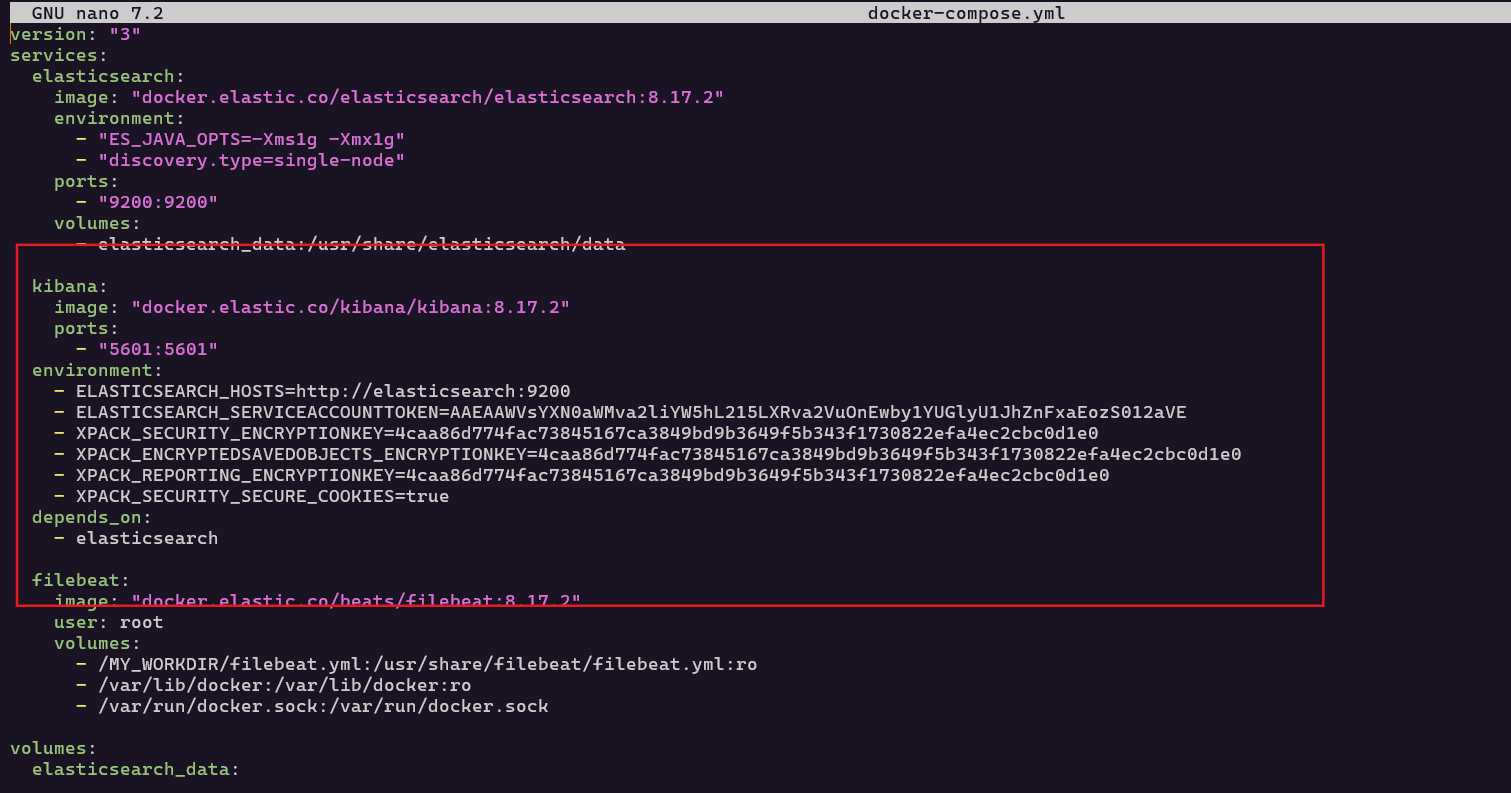
  kibana:
    image: "docker.elastic.co/kibana/kibana:8.17.2"
    ports:
      - "5601:5601"
  environment:
    - ELASTICSEARCH_HOSTS=http://elasticsearch:9200
    - ELASTICSEARCH_SERVICEACCOUNTTOKEN=AAWVsYXN0aWMva2liYW5hL215LXRva2VuOnEwby1YUGlyU1JhZnFxaEozS012aVE
    - XPACK_SECURITY_ENCRYPTIONKEY=4caa86d774fac73845167ca3849bd9b3649f5b343f1730822efa4ec2cbc0d1e0
    - XPACK_ENCRYPTEDSAVEDOBJECTS_ENCRYPTIONKEY=4caa86d774fac73845167ca3849bd9b3649f5b343f1730822efa4ec2cbc0d1e0
    - XPACK_REPORTING_ENCRYPTIONKEY=4caa86d774fac73845167ca3849bd9b3649f5b343f1730822efa4ec2cbc0d1e0
    - XPACK_SECURITY_SECURE_COOKIES=true
  depends_on:
    - elasticsearch
Save and exit the file.
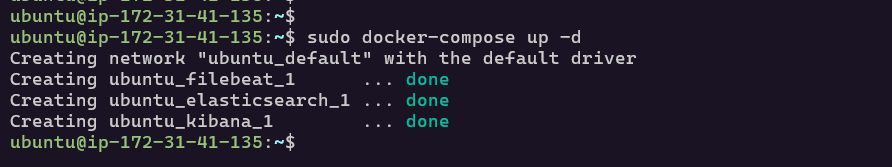
Restart the services.
sudo docker-compose down
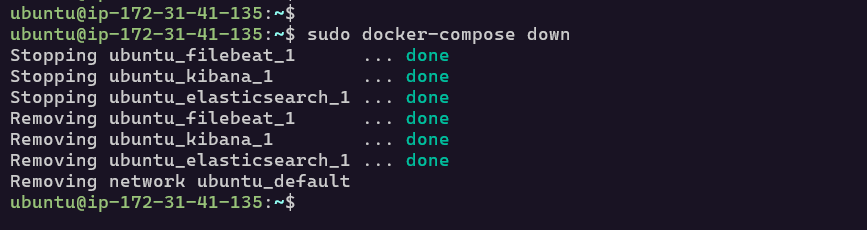
sudo docker-compose up -d
Step #7:Access Kibana
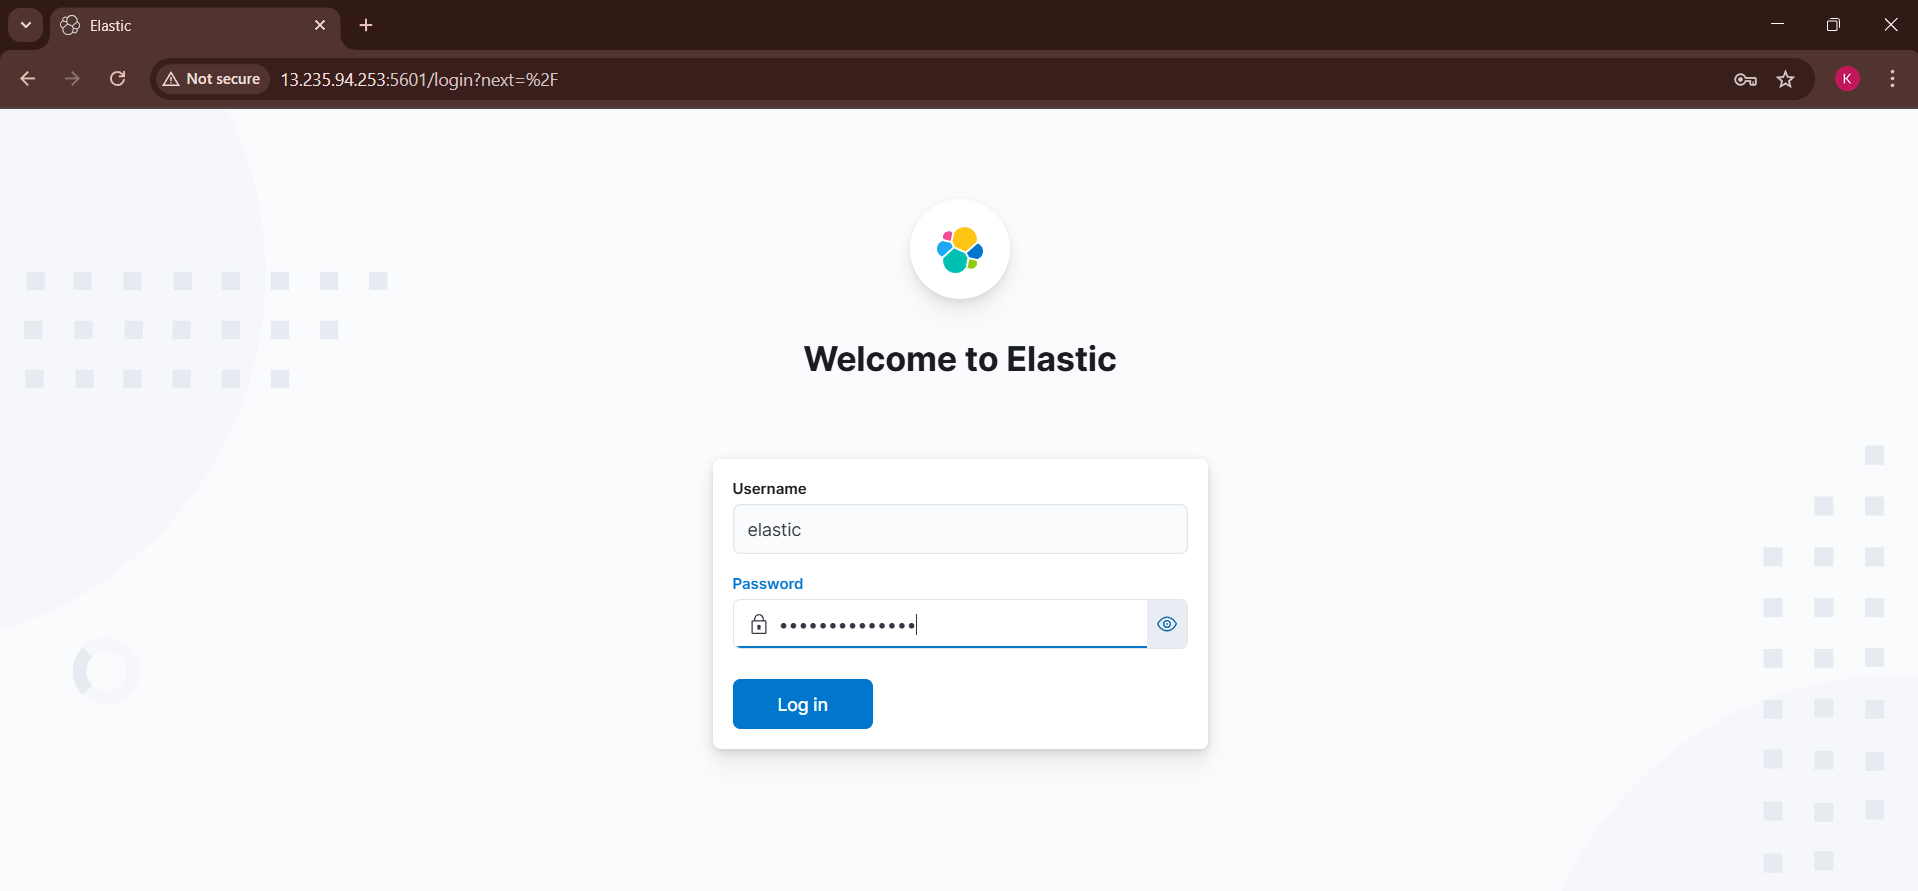
Open your browser and navigate to http://<EC2-PUBLIC-IP>:5601. Log in using the elastic username and the password you set earlier.
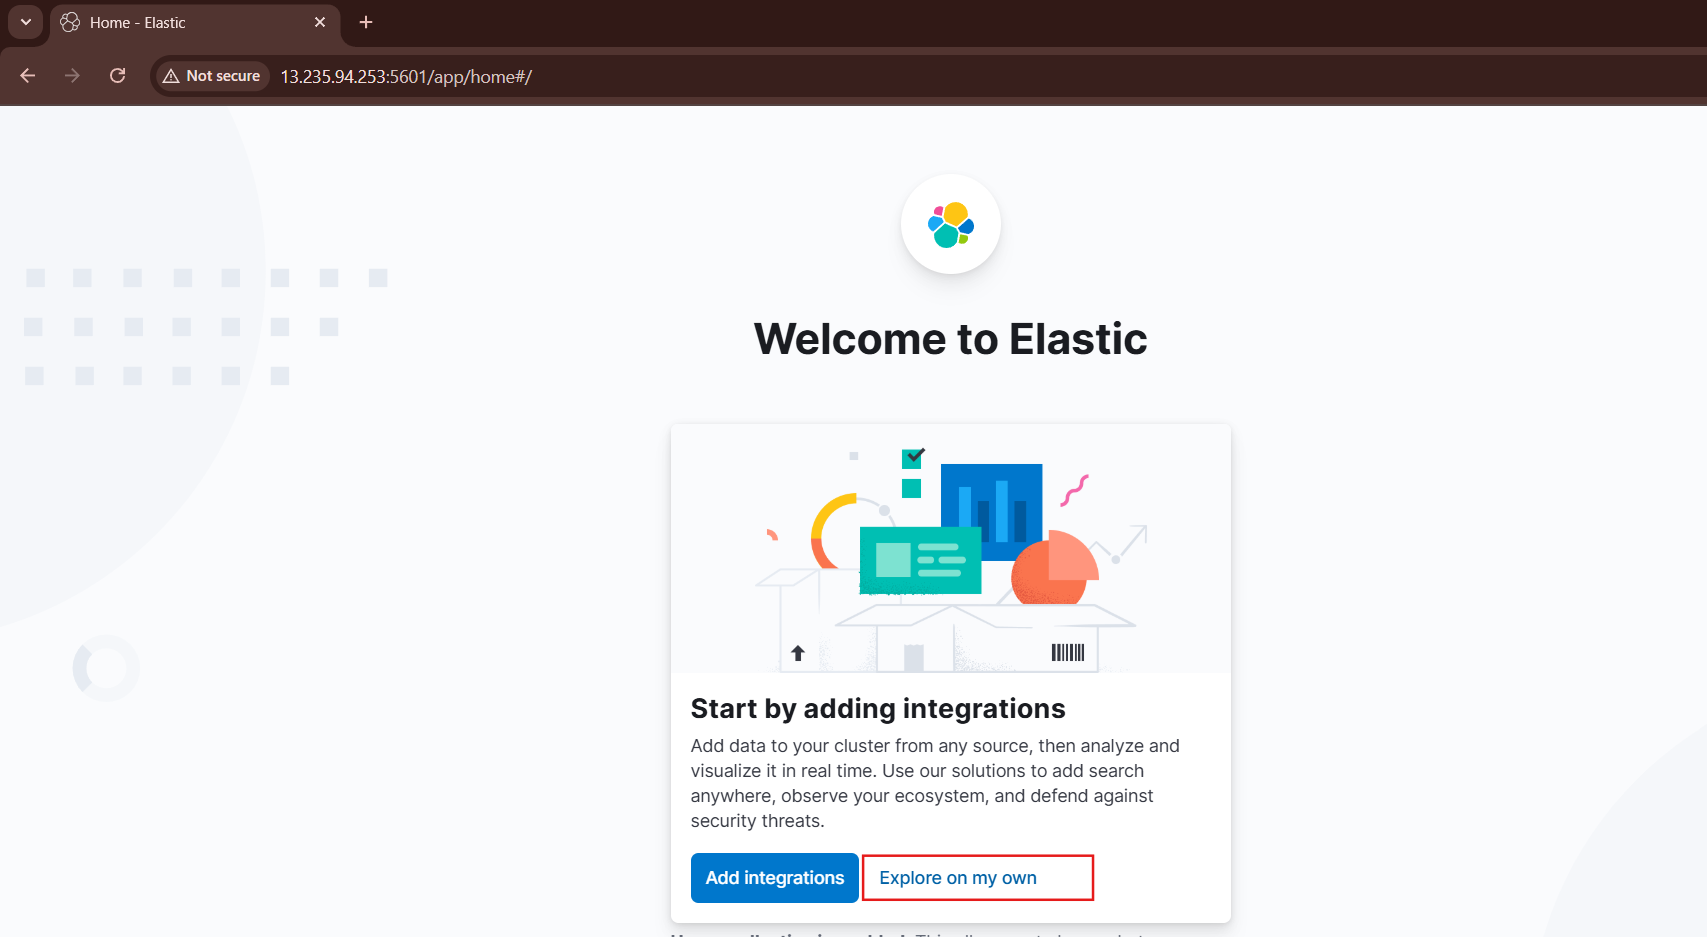
Click on Explore on my own.
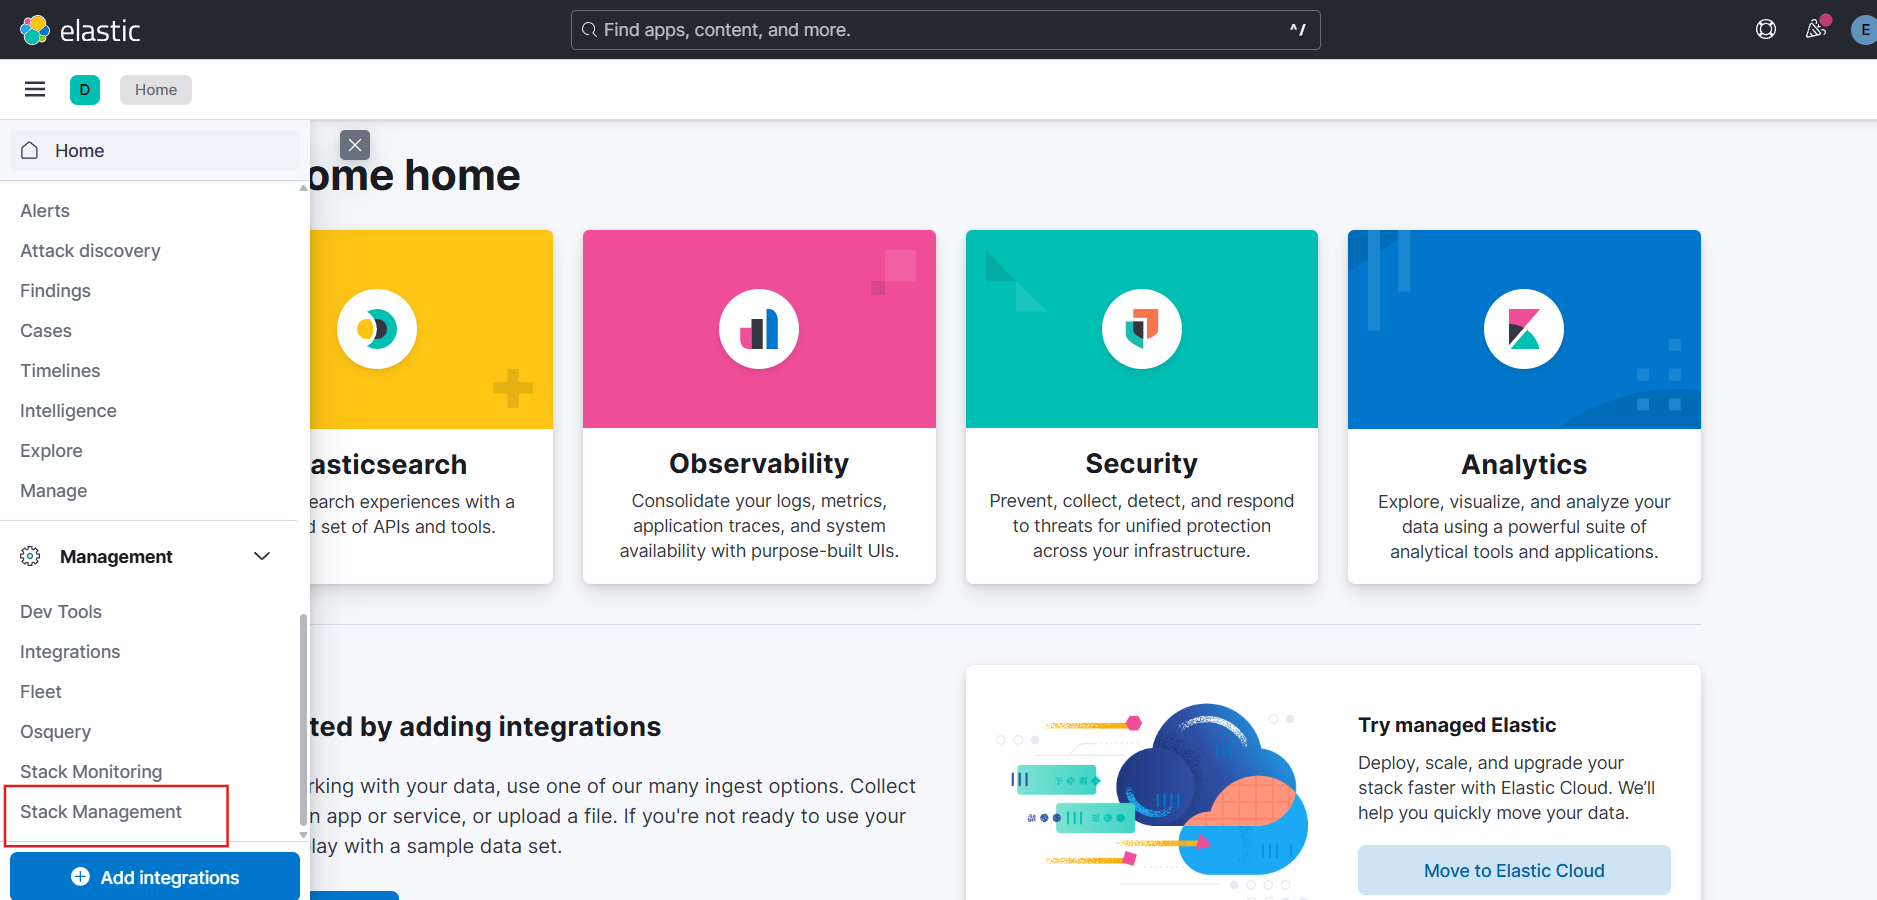
Go to Menu bar from top-left corner and select Stack Management under the management section.
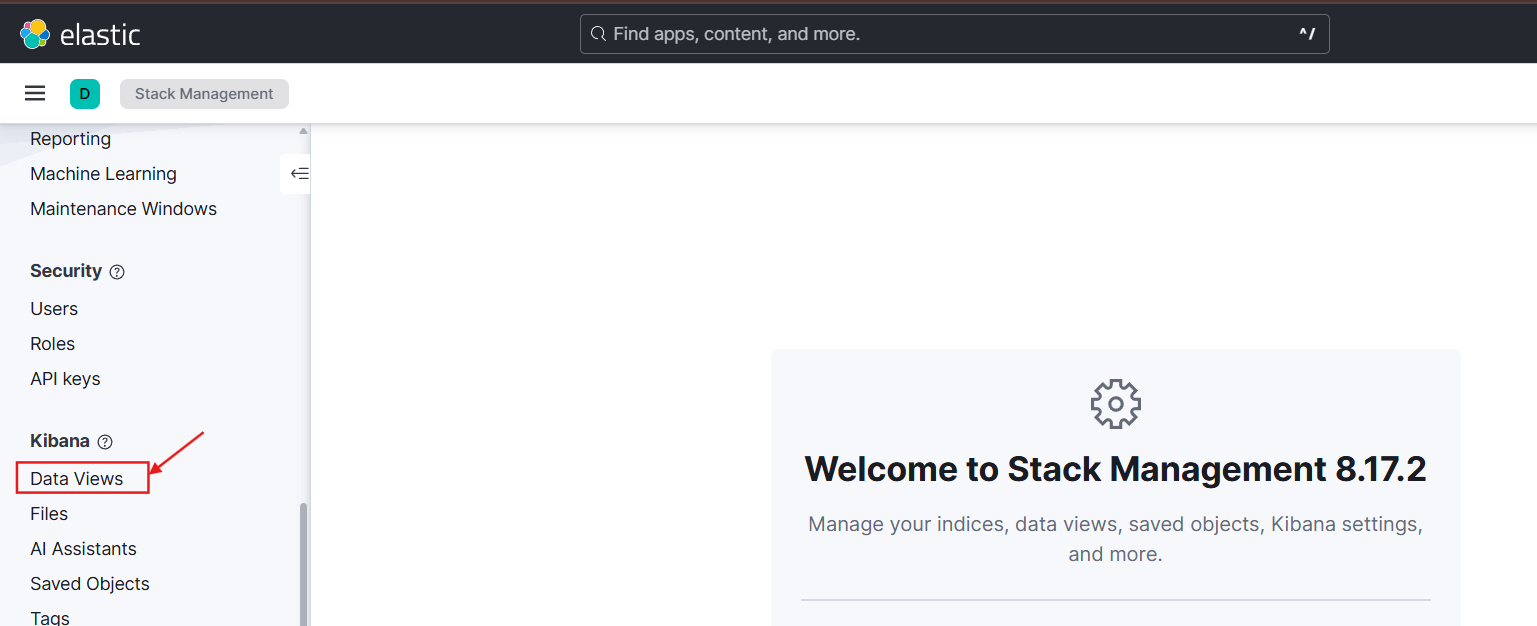
Select Data Views under the Kibana section.
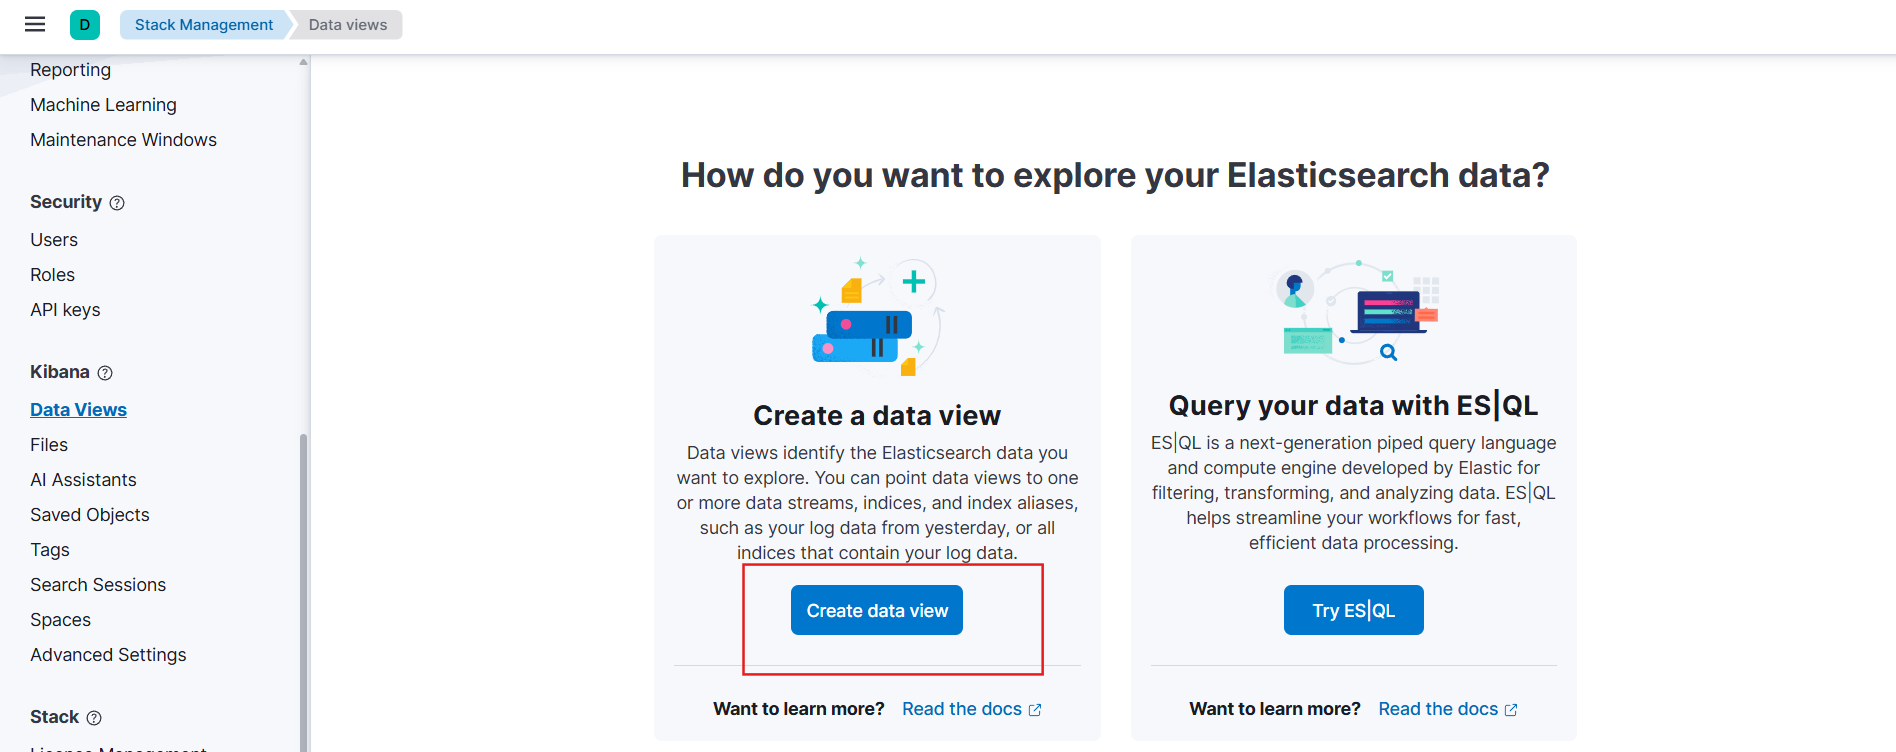
Click on Create data views.
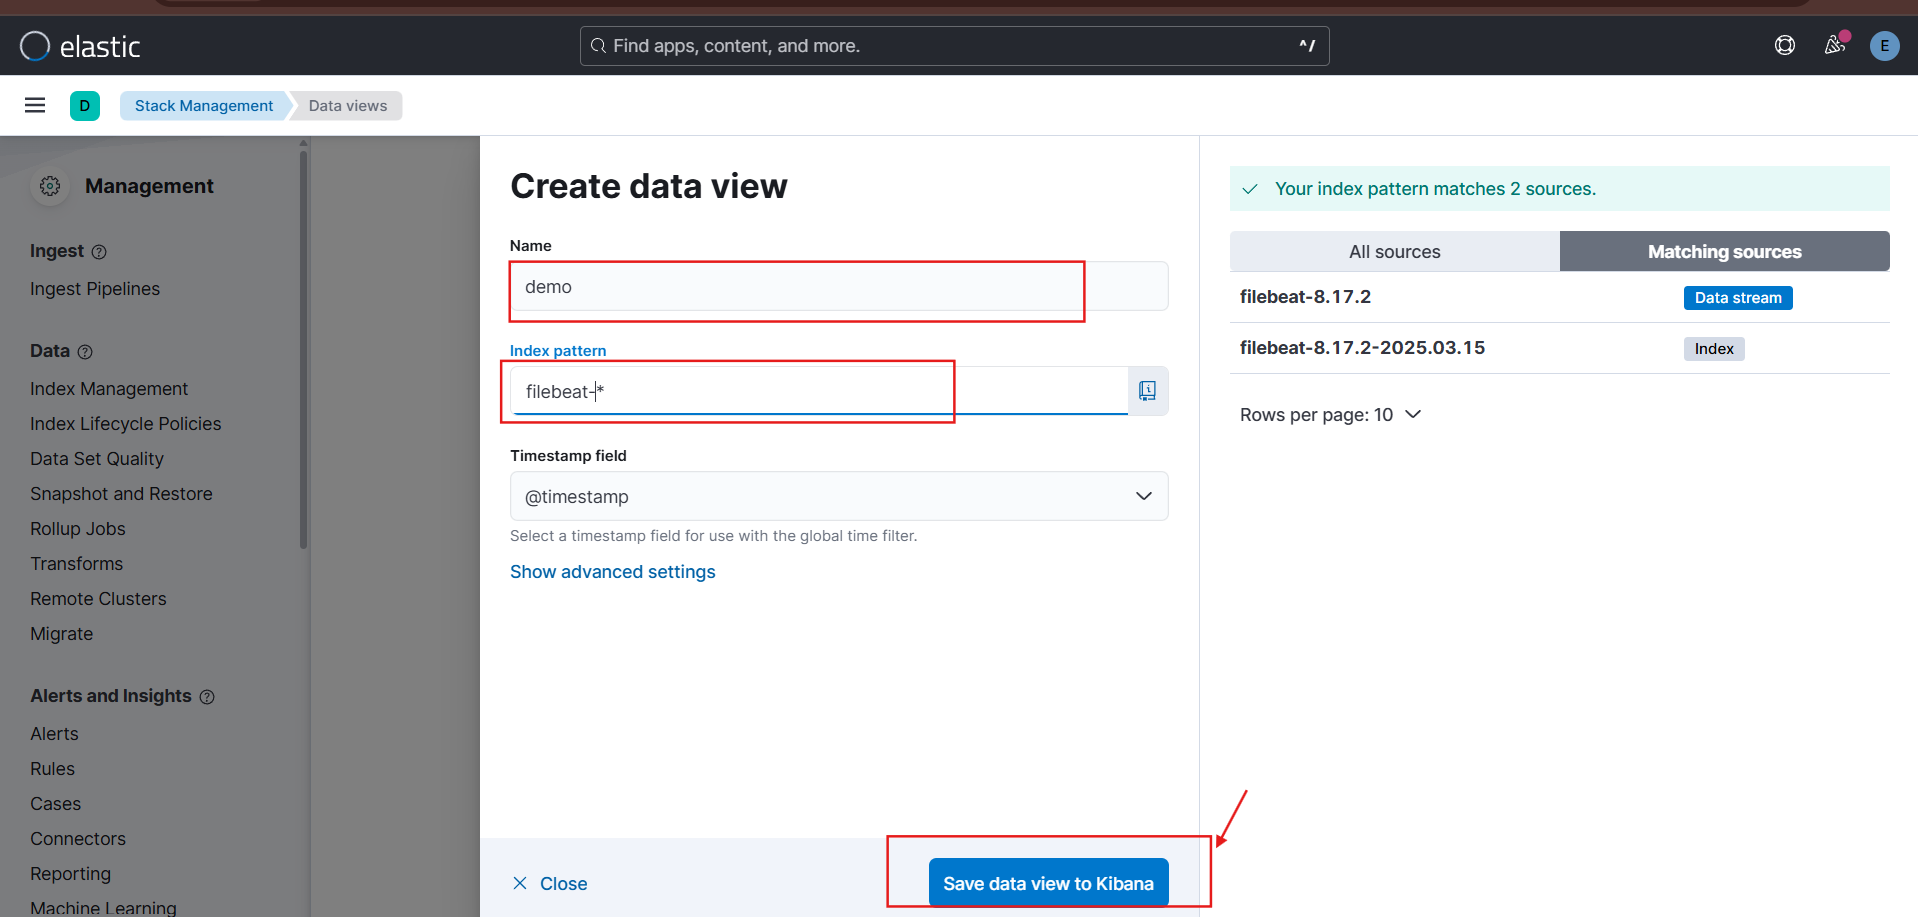
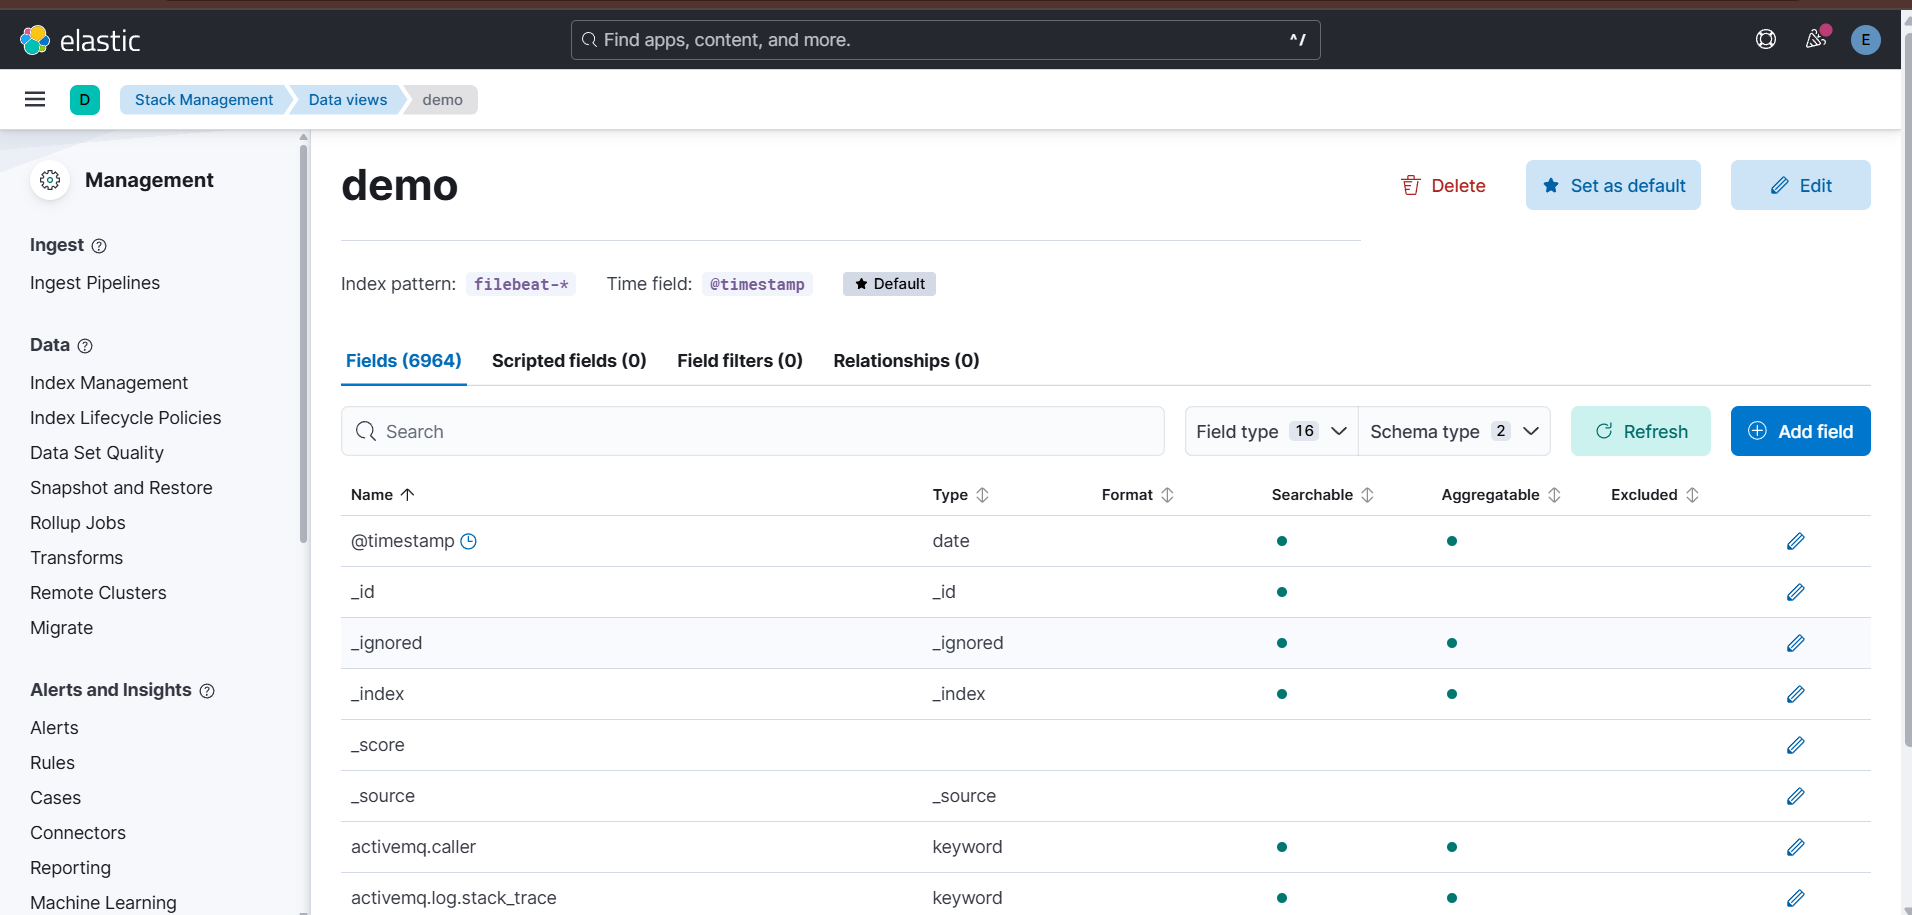
Enter the Name as demo and the Index pattern as filebeat-* and click on Save data view to Kibana.
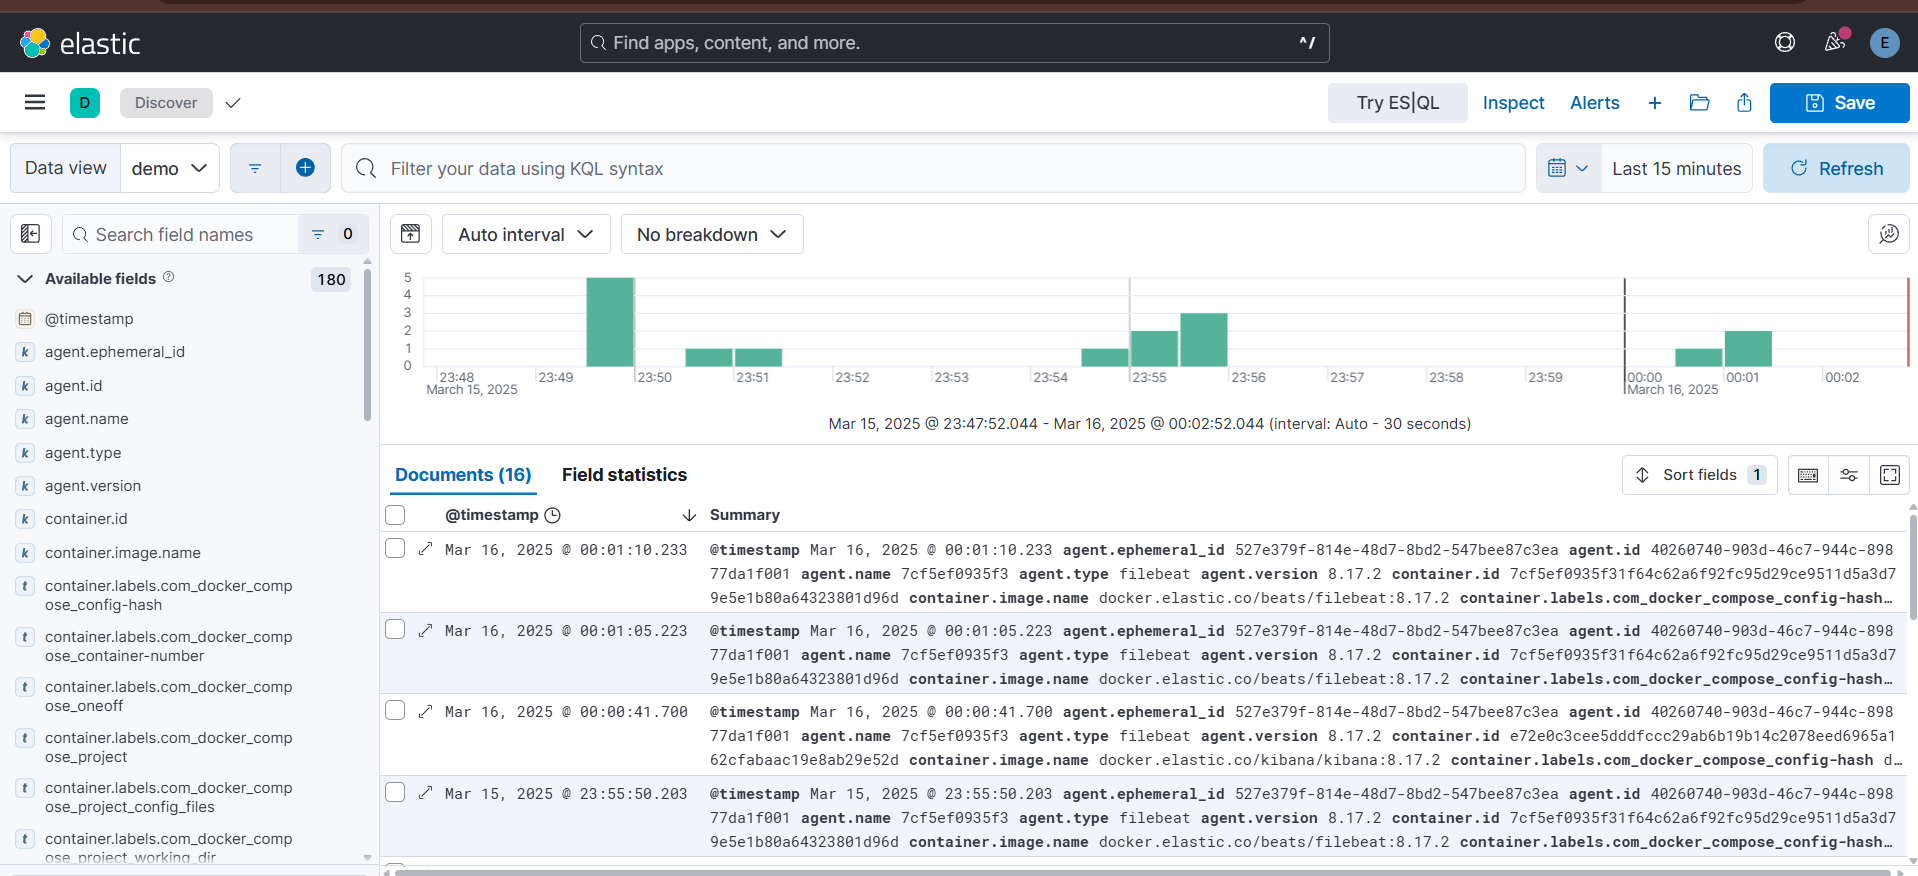
Next to view logs in Kibana, go to Analytics → Discover.
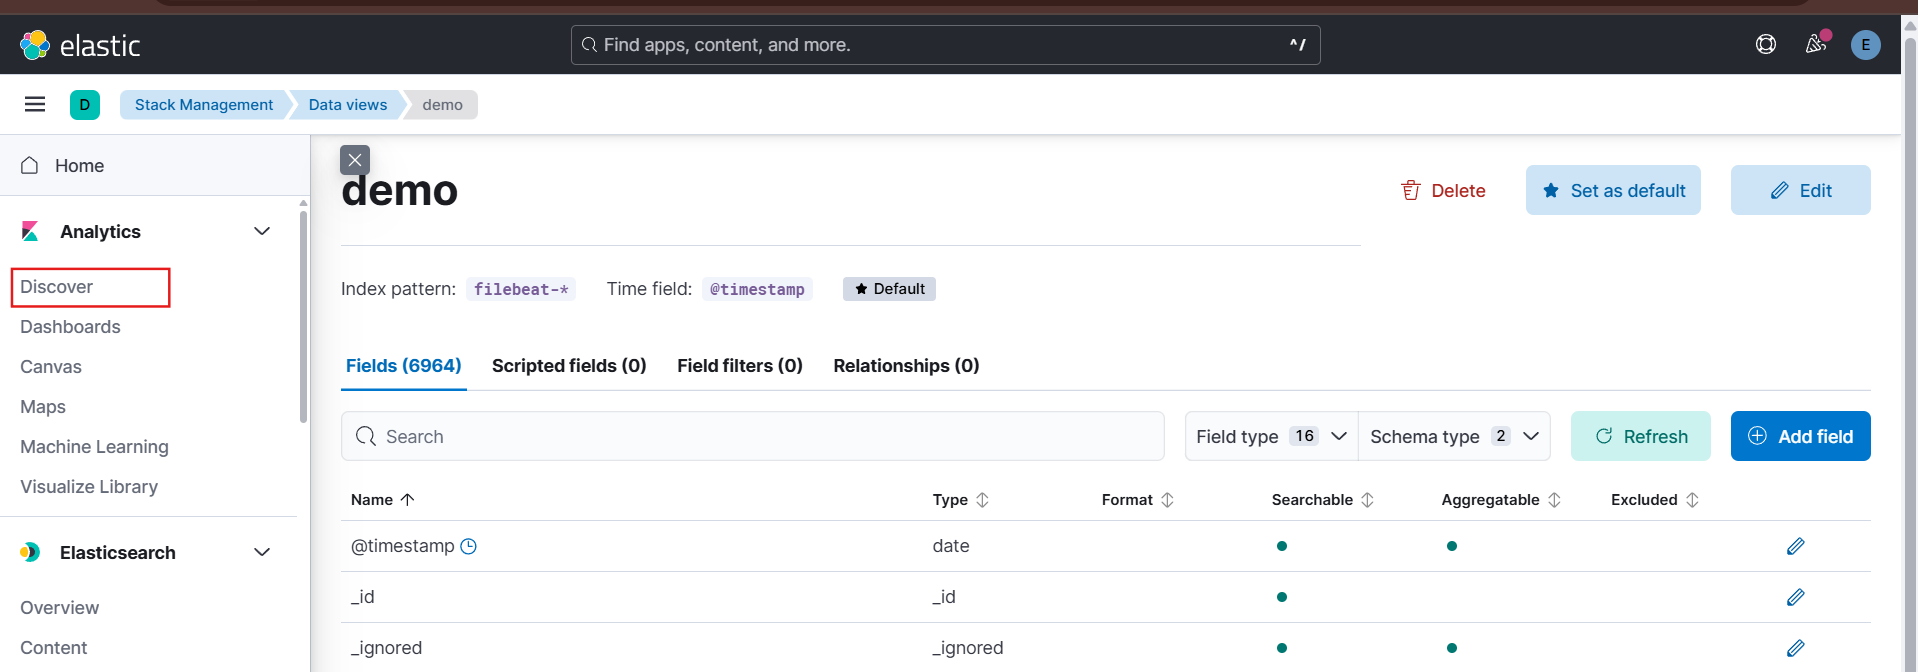
Now you can visualize the generated docker logs.